Getting Started
What is Statusgraph?

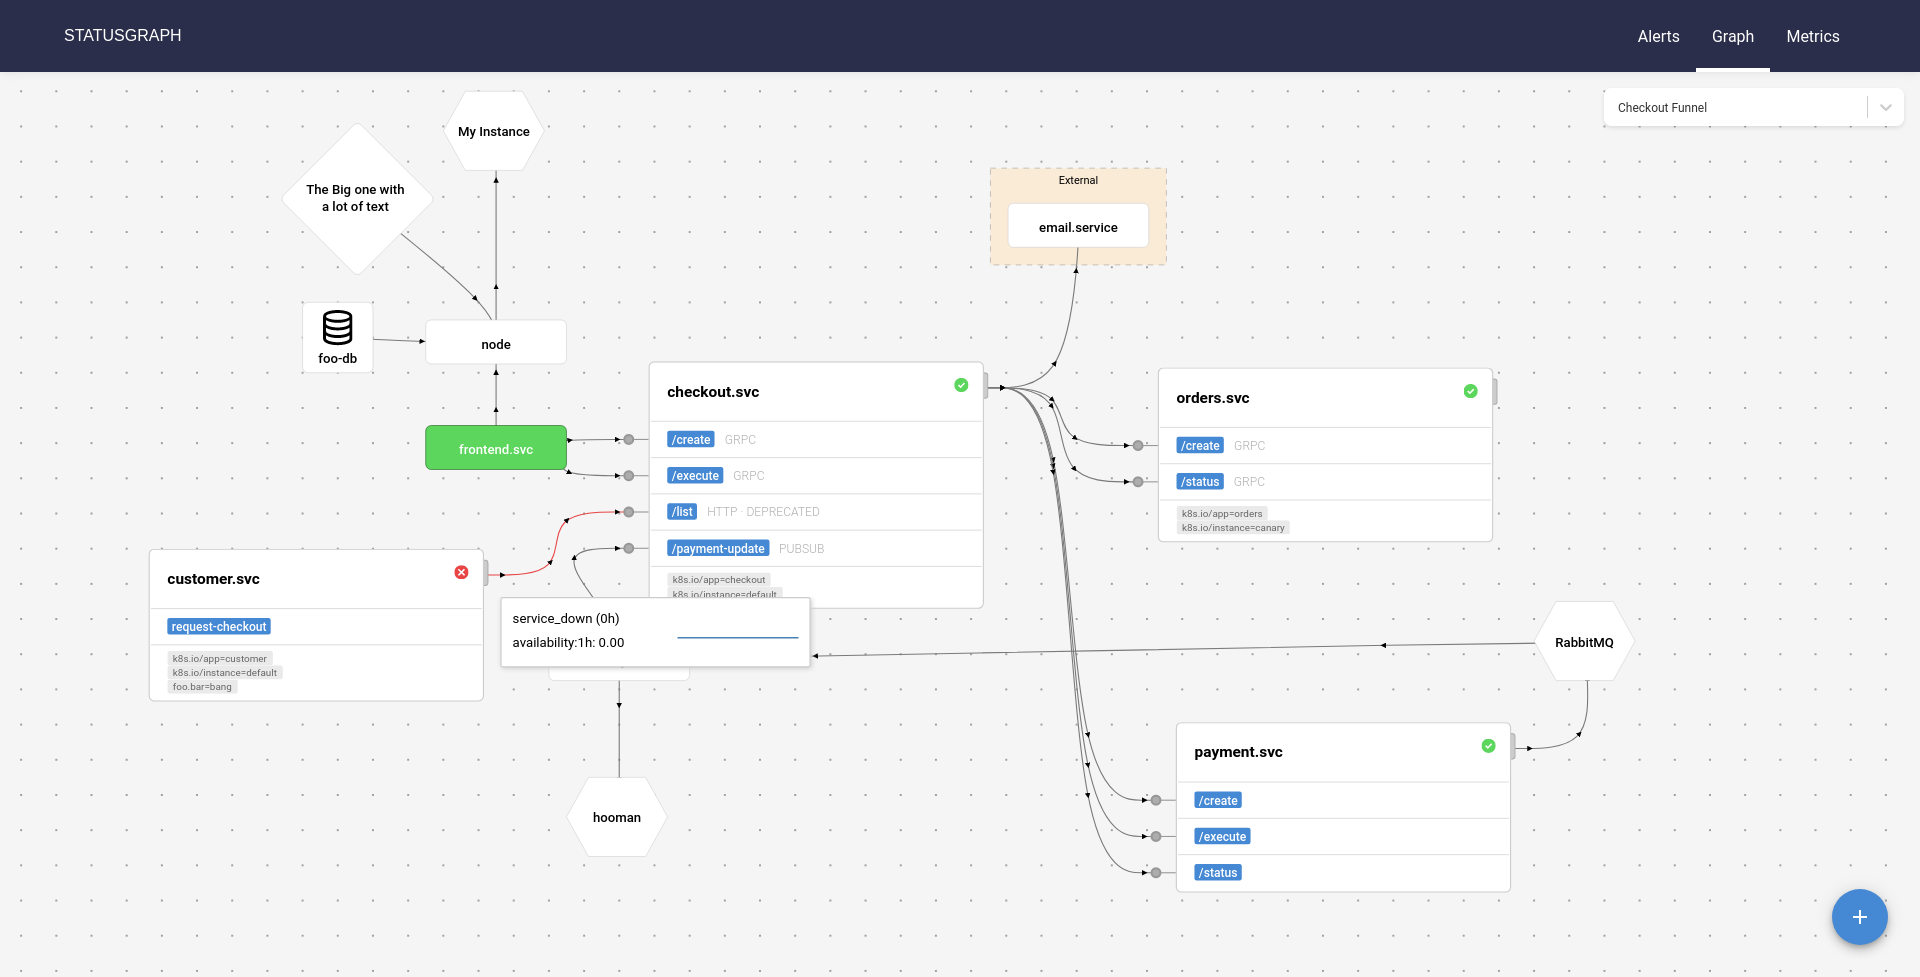
Statusgraph is the status page for your distributed system. It lets you visualize components and dependencies of your system and indicates their status.
Conceptually, you want to know if your service is “running”, i.e. it is in a binary state: red lamp vs. green lamp. This question is incredibly hard to answer. Statusgraph takes this approach:
- define alerts in Prometheus. They tell us when a services is considered in a “red” state (service is dead / not available / has issues ..).
- tell statusgraph how to lookup services (services is in the “green” state)
- map metrics to services
You can visualize many different aspects of your environment.
- 10.000ft view of your distributed system
- self-contained system of a single team (a bunch of services, databases)
- network aspects: CDN, DNS & Edge services
- end-user view: edge services, blackbox tests
- Data engineering pipeline: visualize DAGs / ETL Metrics
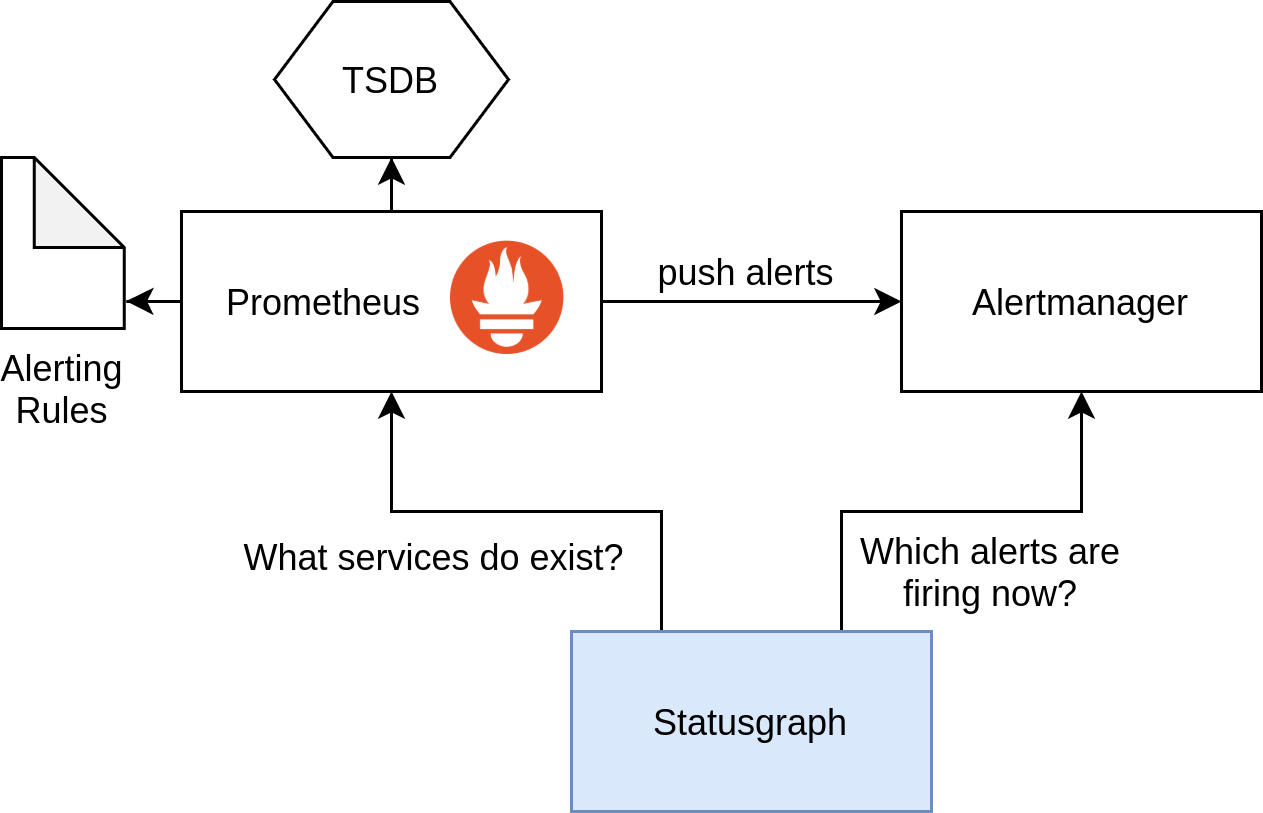
High-Level Architecture

Installation
BEWARE: state is currently stored on disk (a bunch of json files). HA setup is not yet supported.
Prerequisites
- alertmanager v0.20.0 and above
- prometheus
Docker
Docker Images are available on quay.io: quay.io/moolen/statusgraph:latest.
$ docker run -it -p 8000:8000 quay.io/moolen/statusgraph:latest server
Kubernetes, Kustomize & Helm
This repository contains kustomize manifests. See config/default directory:
$ git clone git@github.com:moolen/statusgraph.git
$ cd statusgraph/
$ kubectl apply -k config/default
Helm is not supported. Feel free to contribute.
From Source
You can build statusgraph from source yourself. You need a working go 1.14 environment and node environment.
$ git clone git@github.com:moolen/statusgraph.git
# build standalone client/server
$ make client # builds client bundle at ./client/dist
$ make binary # builds server binary at ./bin/statusgraph
# build docker image
$ make docker-build IMG=docker.io/foobar/statusgraph:dev
Next steps
You may want to check out the the Usage Examples or Configuration.